Net Sphere — Sub-Account
Live data
NetSocial
Powered By Net Sphere
How your social posts are performing across the net sphere sub-account, pulled from Sep 20 – Oct 20 (weekly).
Last synced
Oct 20, 11:56 PM
Total Impressions
0
-57.7%Aug 20 – Sep 19 (previous 30 days)
Total Interactions
0
+0%56 likes · 9 comments
Avg Interactions / Post
1.3
+0%across 50 published posts
Followers
0
50 posts in range
Top 3 Videos
Your best performing videos every week!
#1
972
instagram1 day agoTop performer
If you see us outside filming, come say hi! #sarasota #videomarketing
#2
972
instagram1w ago
We plan it. We shoot it. We edit it. We post it.
#3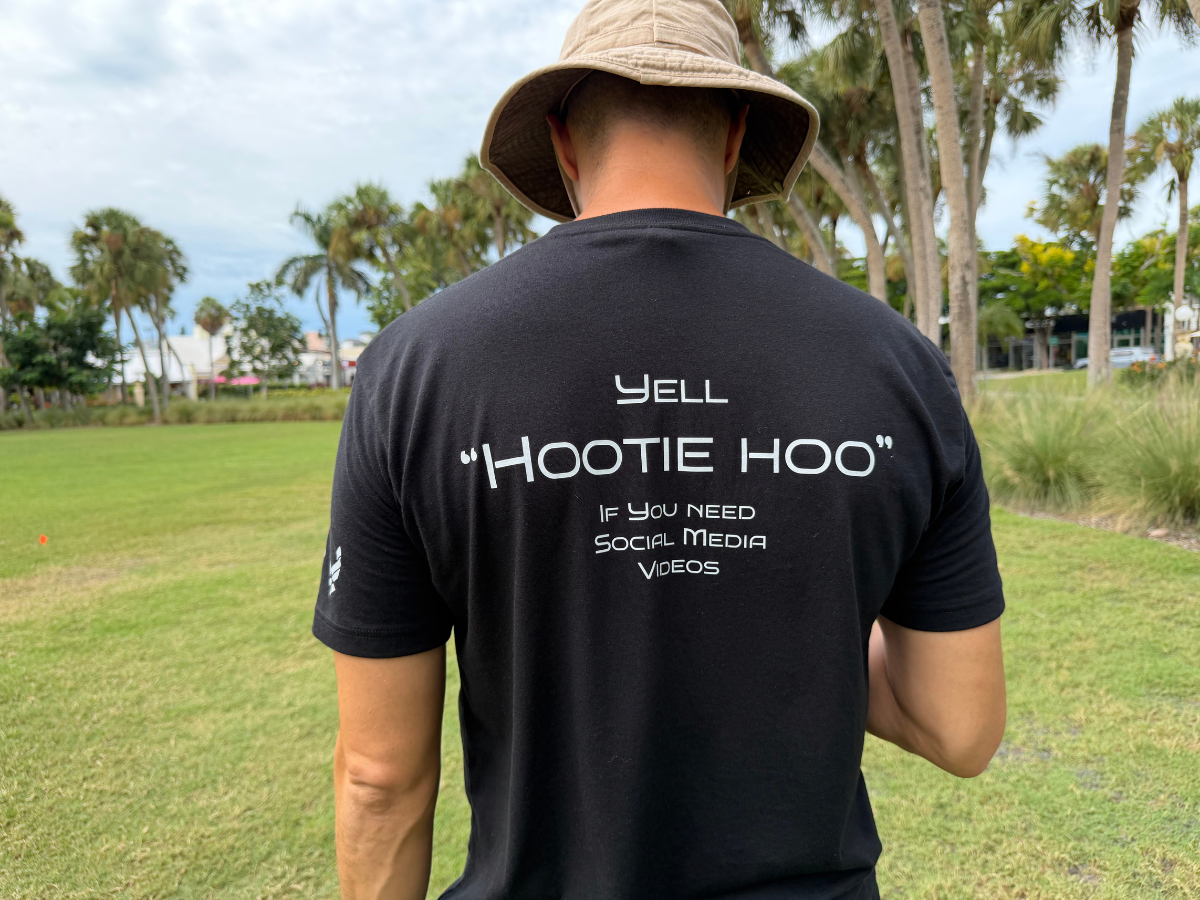
770
instagram2w ago
Our sales team is getting aggressive.
Unlock unlimited video insights
Upgrade your subscription to track more videos and deeper performance analytics.
Impressions & Engagement
Sep 20 – Oct 20 · weekly
ImpressionsInteractions
By Platform
Share of total impressions
fFacebook75.4%· 0.6% eng.
◉Instagram24.6%· 1.9% eng.
GGoogle0%· 0% eng.
56
Likes
9
Comments
n/a
Shares
Recent Posts
5 most recentIf you see us outside filming, come say hi! #sarasota #videomarketing
instagram · 1 day ago
72
If you see us outside filming, come say hi! #sarasota #videomarketing
facebook · 1 day ago
00
If you see us outside filming, come say hi! #sarasota #videomarketing
google · 1 day ago
00
Out making businesses look good.
google · 1w ago
00
We plan, film, edit, and post video content for businesses in Sarasota. 🎥
facebook · 1w ago
10